Dashboard
Customizable project overview with drag-and-drop widgets, live KPI counters, and multiple saved views. See your project's health at a glance — configured exactly how you want it.
Key Features
A project dashboard that adapts to how you work — not a static report you have to squint at.
Drag-and-Drop Customization
Rearrange your dashboard layout by dragging widgets to new positions. Resize them by pulling corners. Save your layout and come back to it every time.
Multiple Saved Views
Create named dashboard configurations for different purposes — a quick daily check, a client-ready summary, or a risk-focused view. Switch between them with one click.
Live KPI Counters
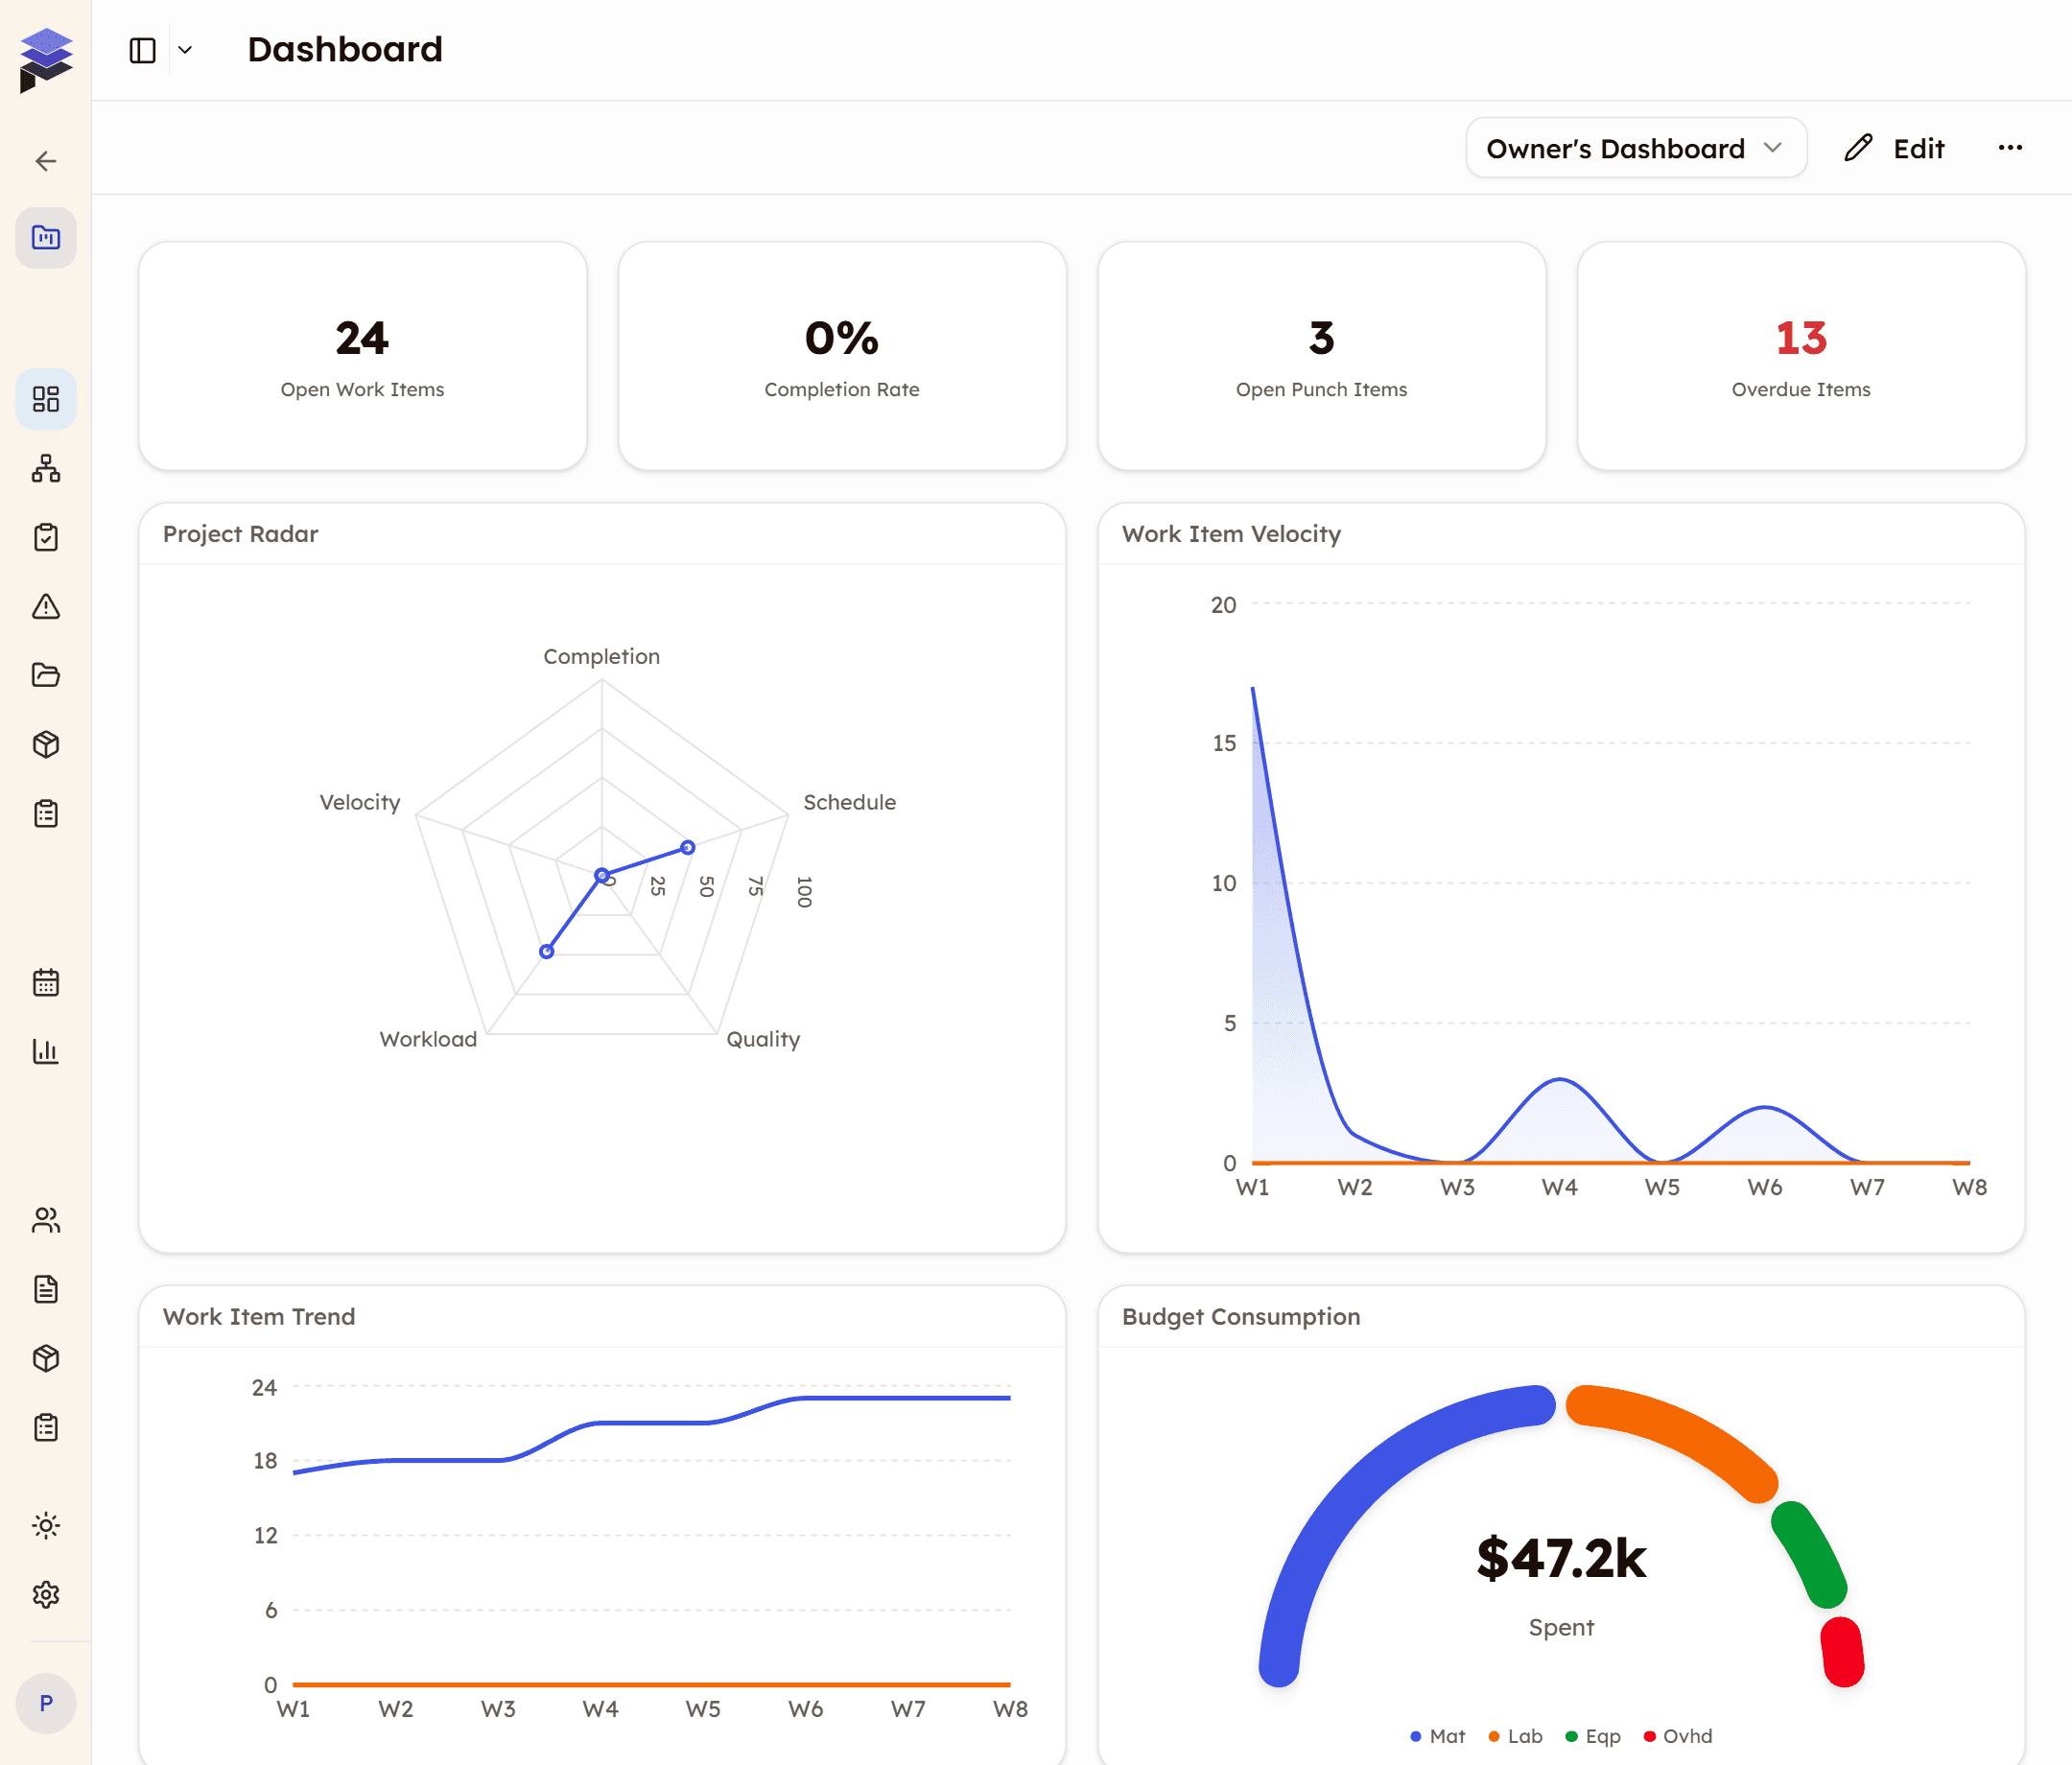
See your most important numbers at a glance: open work items, open punch items, completion rate, and overdue count. All update in real time as data changes.
Rich Chart Widgets
Donut charts, bar charts, area trends, radar plots, funnel visualizations, and waffle grids — pick the visual that tells your story best for each metric.
Portfolio Dashboard
Users managing multiple projects see a portfolio-level overview with project health scores, location context, and cross-project trend charts.
Works on Mobile
All widgets stack and adapt for phones and tablets. Touch-friendly drag-and-drop editing works on mobile too — customize your view from the field.
How it works
Three steps from default dashboard to your personalized command center.
Open your dashboard
The dashboard is the first thing you see. Default layout shows the most important KPIs and charts out of the box — no setup required.
Customize your layout
Click Edit to enter customization mode. Add widgets from the catalog, drag them into position, and resize by pulling corners. Save when you're happy.
Create views for every audience
Save multiple configurations — a quick daily status check, an executive summary for stakeholders, a risk-focused view for the PM. Switch between them instantly.
Why switch from manual reporting?
Most teams rely on weekly spreadsheet reports or slide decks. Here's what breaks and what changes.
The old way
- Status reports compiled manually every week — hours spent pulling numbers from different sources.
- Data is always stale — by the time the report is sent, the numbers have already changed.
- One-size-fits-all reports. The PM, super, and client all get the same view whether it's useful or not.
- No drill-down capability. A number looks wrong? Open another spreadsheet and start investigating.
- Portfolio visibility requires a separate master spreadsheet that someone maintains by hand.
With CivilFlow
- Live dashboard with real-time data — no manual compilation. Numbers update as work happens.
- Always current. KPIs and charts reflect the latest project state at the moment you look.
- Saved views for every audience. Quick daily check, executive summary, risk-focused — switch with one click.
- Widgets are backed by live data. Unusual numbers are immediately visible with trends and breakdowns.
- Portfolio dashboard shows all projects at once — health scores, trends, and drill-down into any project.
Built for the field
All dashboard widgets stack vertically on phones and tablets. Touch-friendly drag-and-drop editing works on mobile too.
- Widgets stack and resize automatically for any screen size
- Touch-based drag-and-drop for layout customization
- Same widget catalog and saved views available on mobile
Frequently asked questions

See Dashboard in action
See how customizable widgets, live KPIs, and saved views give you the exact project overview you need — on any device.
Your project command center — configured how you want it